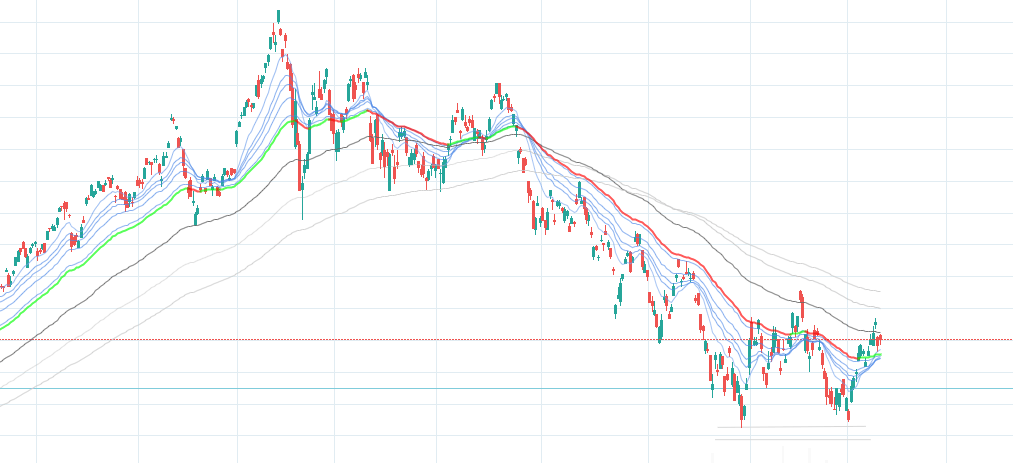
Example of double bottom forming in a downtrend (graph for MCHI China ETF):
It is optimal to combine double bottom pattern with other signals such as RSI (Relative Strength Index), Stochastic RSI, MACD (Moving Average Convergence Divergence), SMA and EMA ribbons (Simple and Exponencial Moving Averages), Parabolic SAR indicator can also help with determination of the end of a down trend.
At the suspected bottom it is also handy to check if P/E values are attractive for the stock (Price to Earnings ratio).
Clone the repository:
git clone https://github.com/tristcoil/detect-double-bottom-in-stocks.git